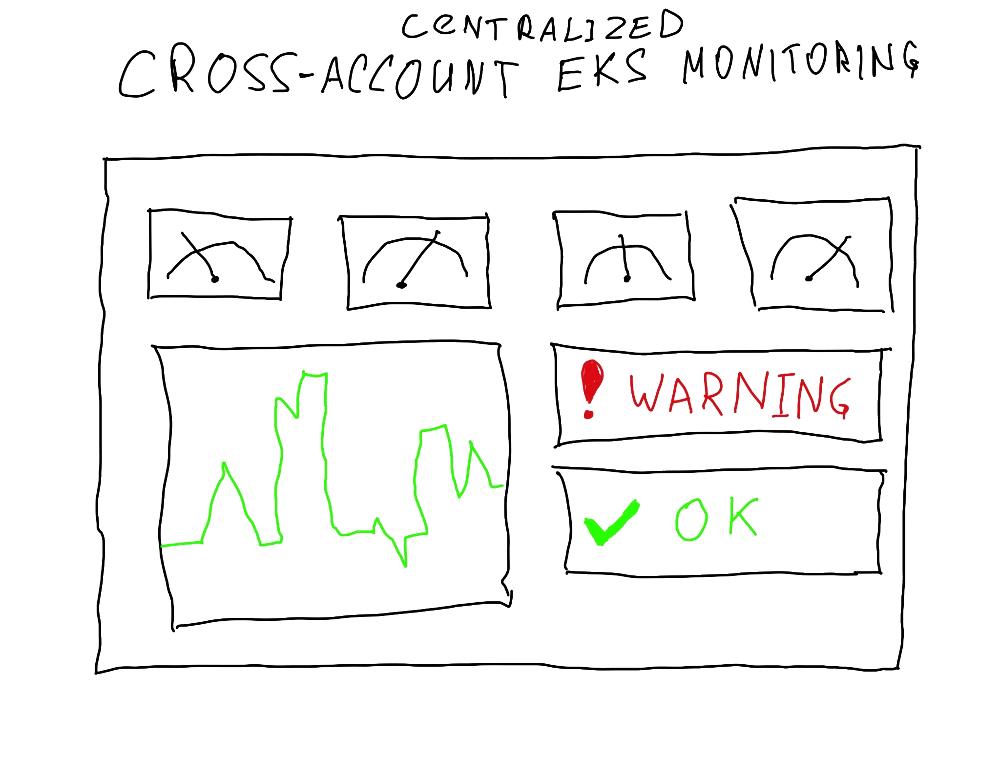
Centralized EKS monitoring across multiple AWS accounts
Complex systems require extensive monitoring and observability. Systems as complex as Kubernetes clusters have so many moving parts that sometimes it's a task and a half just to configure their monitoring properly. Today I'm going to talk in depth about cross-account observability for multiple EKS clusters, explore various implementation options, outline the pros and cons of each approach, and explain one of them in close detail. Whether you're an aspiring engineer seeking best-practice advice, a seasoned professional ready to disagree with everything, or a manager looking for ways to optimize costs -- this article might be just right for you.
Cluster observability #
What is good observability? Good observability answers the questions:
- How is our cluster doing?
- Are all the components working as intended?
- Are there any errors?
- What about our application?
- What do our users see?
- Are they experiencing any issues?
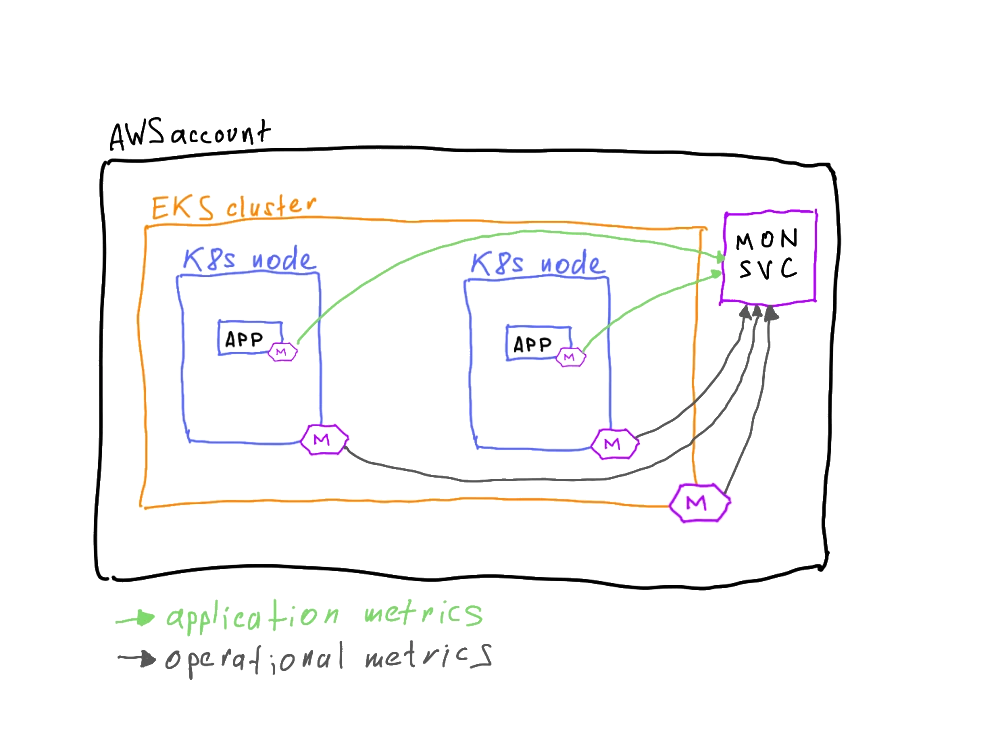
As you can see, apart from the health of the cluster itself, good observability monitors the health of the application and user-facing metrics as well. So far, we can highlight two types of data in our cluster: cluster operational metrics and application metrics.
But is that all? Didn't we forget something?
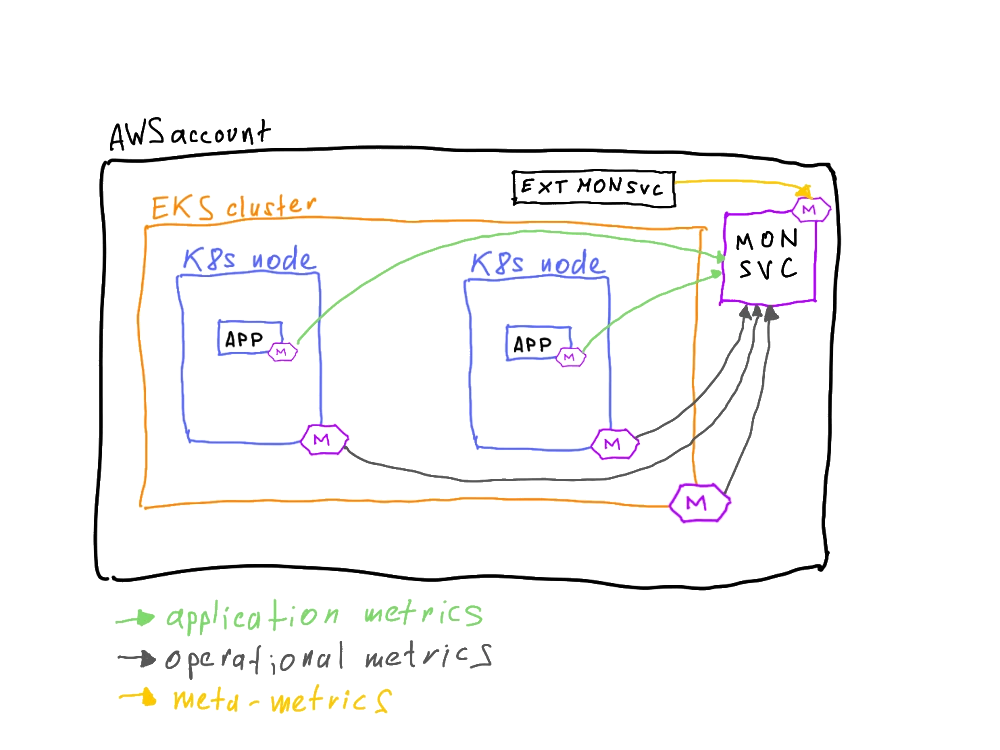
How are we going to find out whether we have issues with our services if our monitoring is down? Exactly -- we can't. So we have to introduce meta-monitoring metrics: the data about the health of the monitoring system itself.
And now we have three types of metrics.
Observability fundamentals #
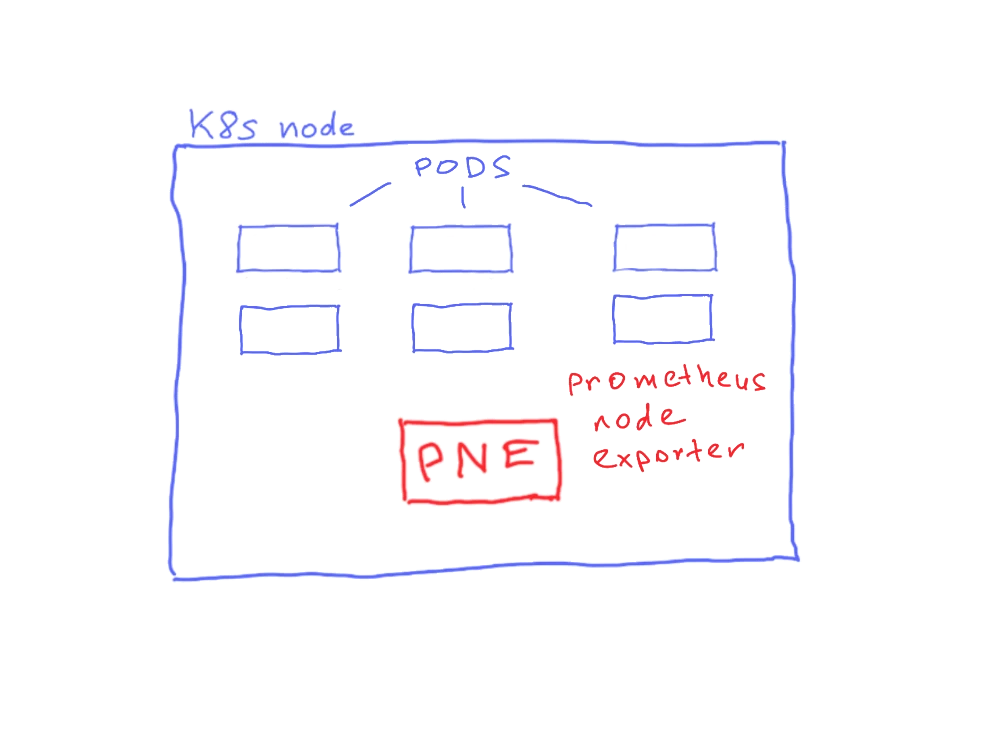
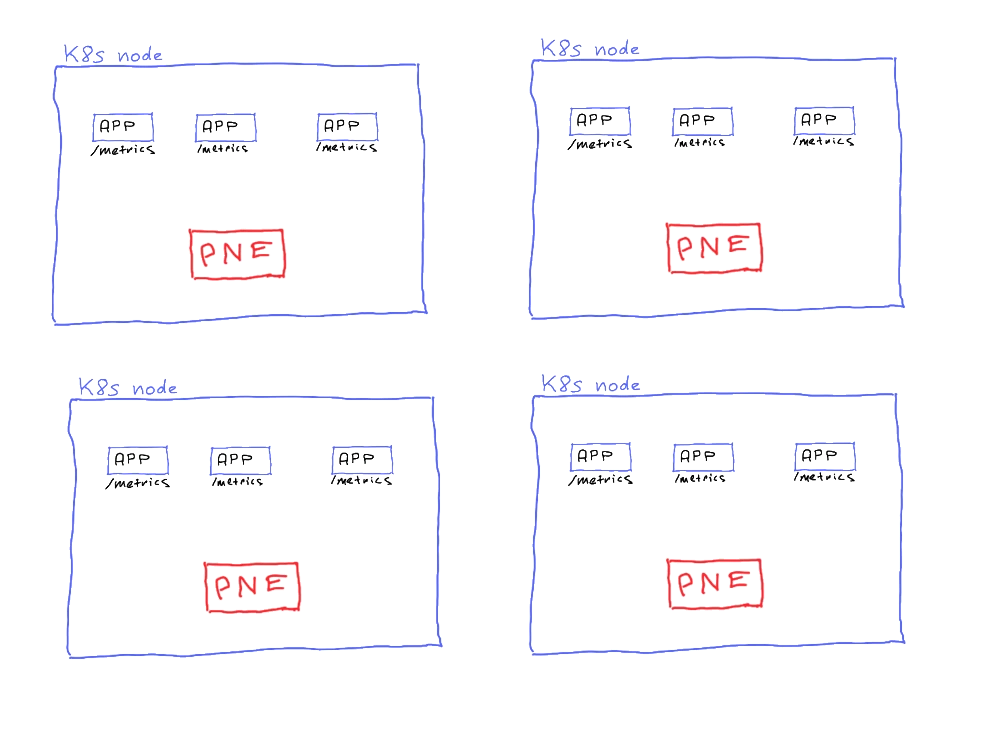
The bare minimum set of data we can scrape from our cluster comes from the Prometheus Node Exporter (or VictoriaMetrics vmagent). This is the most technical data -- CPU, memory, network latencies, temperature, you name it. It doesn't get more technical than this.
But should we stop here? Technical data about our system shows only our part of the setup -- the health of the underlying system. It's extremely helpful when something goes very wrong with our service, but it doesn't show the full picture. To see that, we also need visibility into the customer-facing side of our service. We need application metrics: request latency, number of responses, application errors. The good thing is that exposing a metrics endpoint within our application may be enough -- Prometheus will scrape this endpoint by itself without additional daemons.
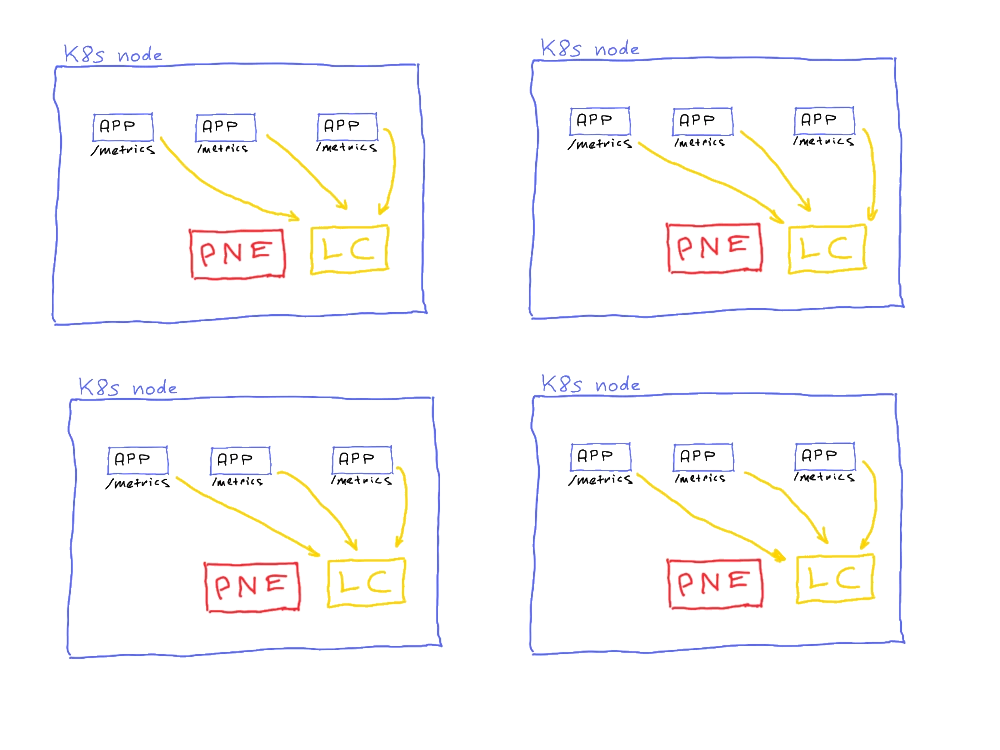
Something's missing, right? For example, where can we see application errors? Not just the error codes or counts, but actual error messages?
Sure, kubectl logs my-pod is cool and all, but a production-ready app is rarely a single pod (at least I hope so, for most of us).
So we think about log collection as well. This adds yet another pod to each node we have: a log collector agent.
Is the picture complete now?
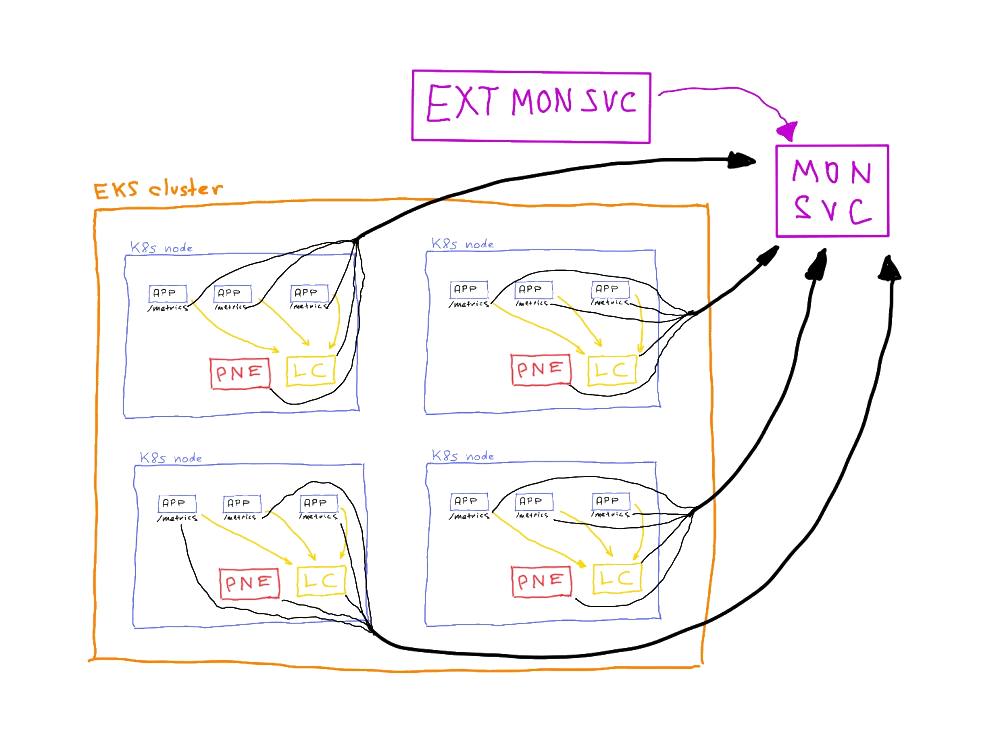
Not quite. As mentioned previously, to check whether our monitoring setup is even alive, it would be nice to have some sort of external monitoring -- the monitoring of the monitoring. Monitoringception. Since the sole purpose of this external service is to answer the question of whether the monitoring is alive, it can be a very simple setup: a daemon that queries the monitoring endpoint. Because this daemon must remain alive even when the whole system is down, it has to run outside the perimeter of the application workload -- on an external EC2 instance outside the EKS cluster. To achieve the maximum independence of the system this service can be set up in an entirely different cloud provider or even on a dedicated VPS in a datacenter on another continent (or in your home lab).
It can even be done as a dead-man switch: an alert in the monitoring system that should always be in the "failing" state and should turn green only if the monitoring system is down. Don't like constant influx of alerts? Set up an notification when data hasn't been received for X minutes, it should do the trick as well.[1]
Cross-account observability #
Now let's crank it up a notch.
This is what a service architecture might look like. But in modern development, it rarely is like this. Mature businesses typically divide their infrastructure by environments -- at the very least, development and production. They might also include, but are not limited to, staging, UAT, etc.
So we spin up both environments in the same cluster, but in different namespaces, right?
This is a bad practice, as resources are still shared between both applications, and one can affect the other in ways we wouldn't want.
The other option is to spin up another environment in the same AWS account, but on a different cluster. Is this a good option? Most likely, yes. Buuuut the Well-Architected Framework and other guidelines advise against sharing a single account between several environments. Full environment separation is better for both account and application security.
So now we have two AWS accounts.
It was fairly simple to organize observability within a single account -- the networks were contained, enclosed in a single perimeter, and available directly from one endpoint to another. Having several accounts introduces the complexity of cross-account networking and finally brings us to the actual topic of this article.
Cross-account networking options #
As with every task in cloud operations, this topic can be approached in several ways:
- VPC Peering
- AWS Transit Gateway
- AWS NLBs with VPC Endpoints and VPC Endpoint Services
- AWS VPN / Direct Connect
- Public internet + Authorization + TLS
Let's discuss each of them briefly.
Note
For the examples below, the cost of each implementation will include only additional charges (i.e., networking and service charges). The price of the monitoring services (Prometheus + storage, Grafana, etc.) will not be referenced.
Note
A table summarizing all the options with detailed price breakdown and implementation complexity comparisons can be found in the annex.
VPC Peering #
This option assumes creating multiple VPC Peering connections from the root account to branched accounts. It is quite cheap and may work well for small organizations with one or two accounts. It may also work if you only plan to create your infrastructure, because it requires CIDR planning: VPC CIDRs cannot overlap with this option. On top of that, you will have to configure route tables manually for each account. On the bright side: same-AZ traffic is free, and VPC peering is also free.
Pros
- Native AWS networking, low latency
- No additional data transfer costs within the same region
- Simple security model with Security Groups
- Direct IP connectivity, no NAT required
Cons
- Non-transitive routing (requires mesh topology for 4+ accounts)
- CIDR blocks cannot overlap between VPCs
- Manual route table management for each peering
AWS Transit Gateway #
This setup looks more like an enterprise-scale solution: better convenience, higher price. It allows for centralized management of the observability networking setup but requires extensive route planning. It is, however, very scalable by utilizing Transit Gateways, which can be attached to a large number of accounts. It can also be shared across organization accounts via Resource Access Manager (one more point for house Enterprise).
Pros
- Scalable to hundreds of VPCs
- Centralized management
- Supports overlapping CIDR blocks with routing domains
- Single point of policy enforcement
- Can be shared across accounts via Resource Access Manager
Cons
- Pricy
- Additional hop adds ~1-2 ms latency
- More complex initial setup
- Bandwidth limits per VPC attachment (50 Gbps burst)
- Requires careful route table planning
AWS NLBs + VPC Endpoints and VPC Endpoint Services #
The third option, almost the golden mean, involves exposing services via Network Load Balancers and Endpoint Services and connecting to them via VPC Endpoints. It is cheaper than the previous option but more expensive than the first. NLBs and VPC Endpoints cost money to simply run. On the other hand, it doesn't limit the number of accounts that can be connected, doesn't require route table configuration, doesn't traverse the public internet unexposed, and with one-to-many connections, you only need to configure a small number of endpoints and endpoint services.
Pros
- No CIDR overlap issues
- Works across regions
- Manual control over who can connect: accept/refuse endpoint service connections
- Private connectivity without internet exposure
- No route table modifications needed
Cons
- Higher cost
- Requires NLB per source cluster
- Additional latency from the NLB layer
- Cross-region data transfer can be expensive
AWS VPN / Direct Connect #
This option is an overkill unless you have a dedicated NOC department, because it has all the fun: full network connectivity, encrypted traffic, interface configuration, BGP configuration, and many associated charges for traffic and connection speed.
Pros
- Full network connectivity
- Can support multiple use cases beyond monitoring
- Encrypted tunnels
- Direct Connect offers dedicated bandwidth and lower latency
Cons
- Requires a specialized NOC department
- You will have to have an existing datacenter to justify using Direct Connect
- High cost (especially Direct Connect)
- Complex setup and management
- VPN has bandwidth limitations (~1.25 Gbps per tunnel)
- Direct Connect has long setup times (weeks)
- Requires BGP knowledge for Direct Connect
Public Internet + Authorization + TLS #
And the final option: the very basic "just shove it onto the public internet and slap a login page on top of it" approach. Super simple to set up! Just spin up an ALB before the Prometheus instance, season it with TLS certificates, and expose it to the public internet. Super unsafe! Works for hobby and experimental projects. Please don't use in a production environment (unless you are absolutely certain -- but still, please don't).
Pros
- Simplest networking
- No VPC connectivity required
- Works across any AWS accounts/regions
- Easy to test and debug
- Lowest AWS networking costs
Cons
- Security concerns
- Data transfer over public internet
- Potential latency/reliability issues
- Harder to pass security audits
- Need to manage SSL certificates
- Vulnerable to DDoS
As you can see, there are several options to consider and choose from. All of them have their pros and cons. For my scenario, I ended up choosing to set up NLBs with VPC Endpoints.
Why?
The first reason is that it's relatively easy to implement. To set up a connection between accounts, we need only an endpoint service and endpoints in the other accounts (plural). They connect in a one-to-many relationship: one endpoint service can handle several connecting endpoints.
The second reason is that I had overlapping CIDRs in each account, so VPC Peering was immediately off the table.
The third reason is that it has moderately less configuration overhead. I won't have to configure client connections or route tables. Proper routing between multiple accounts is a very precise art at which I most certainly suck.
And the last reason is that it's still quite secure. The traffic from services doesn't leave the AWS network, doesn't traverse the public internet, and connections are only allowed after approval (it can be configured to auto-approve, though, which may be convenient -- but healthy paranoia is my constant companion).
Chosen cross-account solution #
The whole system is actually not that overcrowded.
For the sake of this article, let's assume we have three products: Bulba, Char, and Squi. Each product has two environments: normal and sparkling. We also have a root account (let's call it Ketch) for organization management and, for simplicity, observability as well. This gives us seven AWS accounts and seven EKS clusters. Why seven and not six? Well, the root account also runs an EKS cluster as an observability backend.
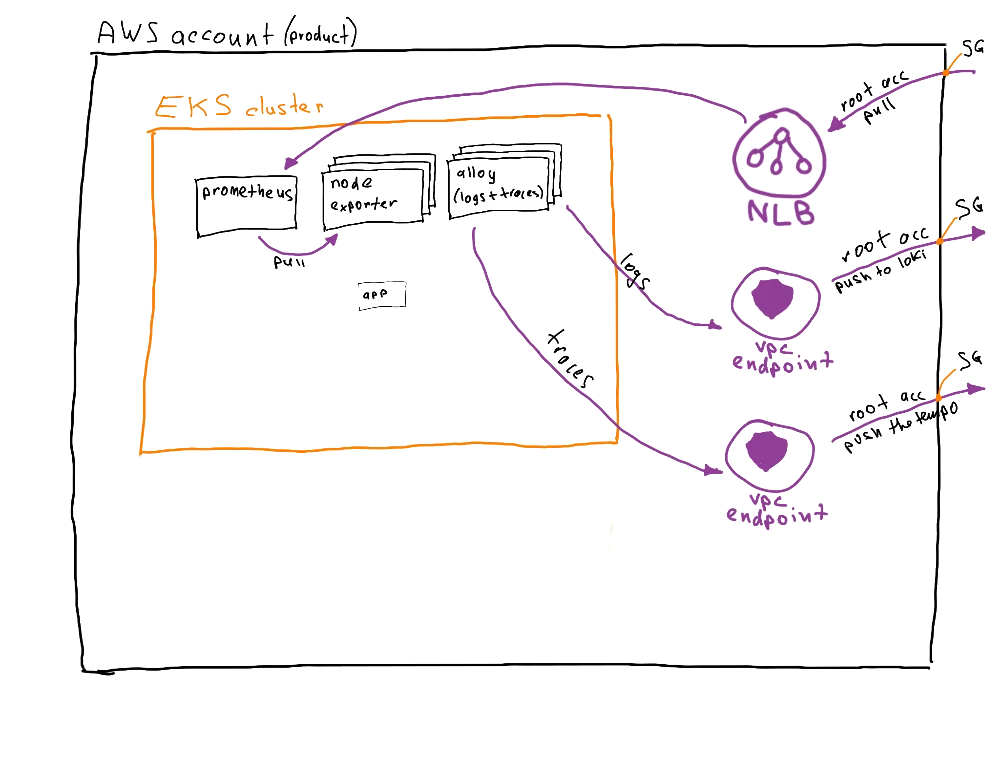
Each product account (Bulba, Char, and Squi) includes the following elements:
- EKS cluster:
- Prometheus server
- Node exporter pods
- Logs and traces collector pods (for my setup, Alloy, I choose you!)
- Internal NLB to expose the Prometheus backend as a service (only in the private subnet)
- Endpoint service that exposes the NLB for Prometheus. For each deployed endpoint service, a corresponding endpoint must be created in the root account (more on that later)
- Endpoint for connecting to the root account logging solution (Loki)
- Endpoint for connecting to the root account tracing solution (Tempo)
- Security groups with allowed ingress and egress ports
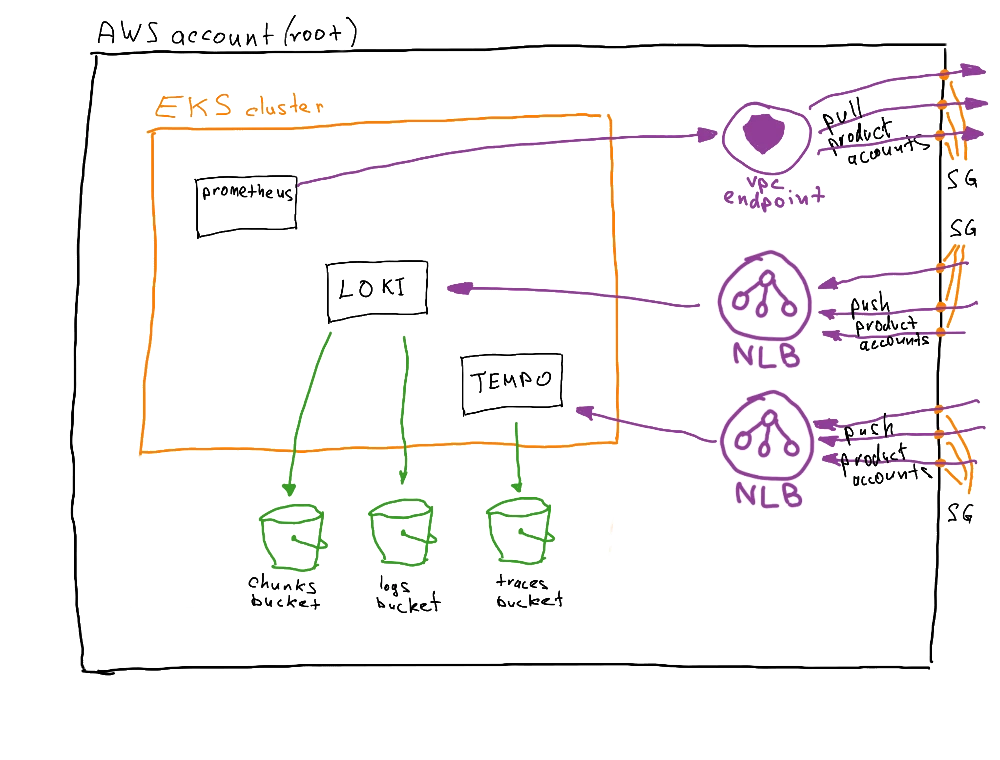
The root account (Ketch) also contains several elements:
- EKS cluster:
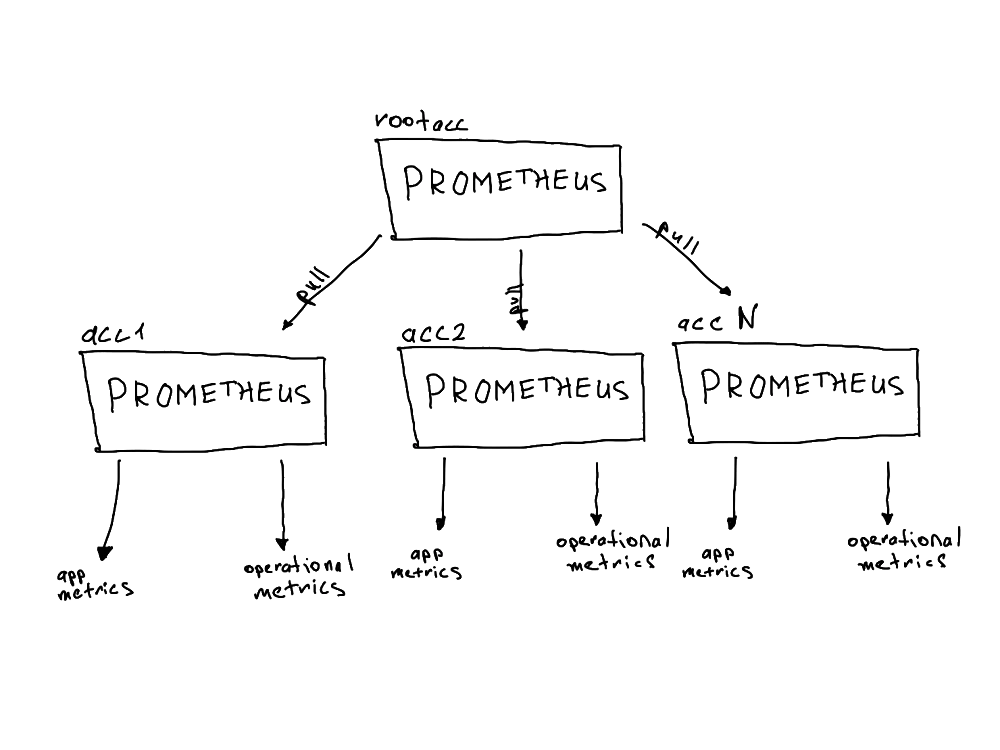
- Prometheus server: centralized Prometheus backend that queries federated Prometheus backends in product accounts
- Loki backend, which receives logs from product accounts
- Tempo backend, which receives traces from product accounts
- Internal NLB to expose Loki backend as a service (in the private subnet)
- Internal NLB to expose Tempo backend as a service (in the private subnet)
- S3 buckets for chunks and logs (Loki)
- S3 bucket for traces (Tempo)
- Endpoints for connecting to product account Prometheus backends in federated mode
- Endpoint service for Loki, which accepts endpoint connections from product accounts
- Endpoint service for Tempo, which accepts endpoint connections from product accounts
- Security groups with allowed ingress and egress ports
That's quite a lot of components to keep track of. Luckily, we have IaC to ease the configuration and deployment of these components.
To understand why so many components are needed (particularly the endpoint service-endpoint pairs), we need to look at the traffic flow model.
Zooming in a bit, we can see the exact details of how the connection is configured.
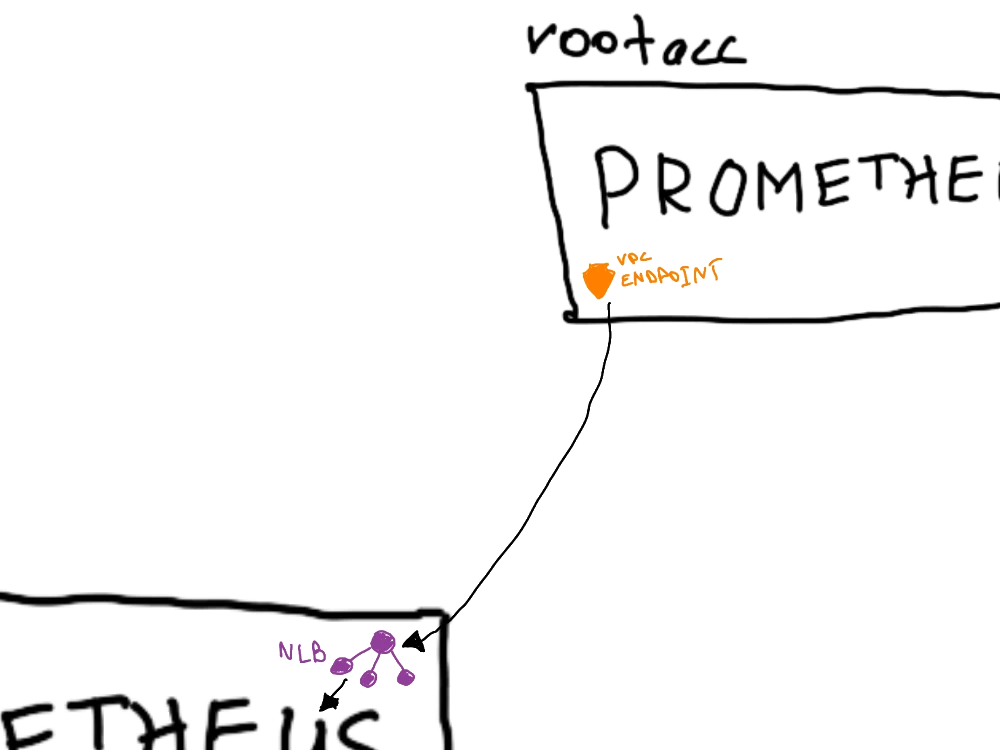
Since our goal is to keep metrics data secure and prevent it from traversing public subnets or the public internet, we create an endpoint service. This service acts as an open receiver on one account (the product account) for the connector on the root account. This creates a 1-to-1 connection that is both secure and governed, since requests to connect to the endpoint service must be approved.
The setup for metrics differs from the setup for logs and traces.
Prometheus uses a pull model: the backend queries the endpoints for data, effectively pulling the data from them. Loki and Tempo, however, use a push model: deployed logs and traces collection pods send (push) the data to the centralized backend.
In this case, the endpoint service/endpoint pair is reversed and simpler: only one endpoint service per service (two in total) is created in the root account, and all product accounts create endpoints and request connections with the root endpoint service.
And this is how the accounts look in the end:
Tip
For consistency, you might want to use a metrics-gathering service with a push model (e.g., the aforementioned VictoriaMetrics vmagent). This way, endpoint services are only created in the root account, and product accounts only have endpoints.
Operational considerations #
As mentioned previously, the solution I chose in this article is not the only correct one out there. For this setup, I had specific requirements that needed to be fulfilled, as well as particular implementation caveats to consider.
My example is definitely not the cheapest option. The cheapest would be using VPC Peering. But unfortunately, my existing setup -- with the same CIDRs in EKS clusters and the possibility to extend beyond those six (+1) AWS accounts -- made this option unavailable.
The described setup is also located in a single region -- in cross-region data transfer scenarios, costs can increase drastically and very quickly. For each additional region, an additional VPC endpoint/service will have to be created.
There's also always the possibility to just expose the backend ports to the public internet (with proper authorization, of course!) and don't bother with endpoint configuration entirely. But even with TLS-encrypted traffic, this is a rather unsafe option and will absolutely not help you pass any SOC 1/SOC 2/ISO 27001 certification.
Closing thoughts #
This was a very interesting challenge to tackle and implement -- I had an absolute blast setting up the POC and confirming that it works. I was excited by the variety of options I could choose from and the differences between the tools available in these scenarios.
And I think it's beautiful. It not only shows the complexity of AWS services (which can sometimes be a downside), but also that there's always more than one solution to each problem. Every engineer will approach a challenge differently -- which, in my humble opinion, means our jobs are secure for the observable future.
Thank you for reading, and see you in the next one!
Annex #
A. Summarizing table #
| Option | CIDRs can overlap | Scalability | Implementation Complexity | Price |
|---|---|---|---|---|
| VPC Peering | X | ●○○ | ●●○○ | $ |
| AWS Transit Gateway | ✓ | ●●● | ●●●○ | $$$ |
| AWS NLBs + VPC Endpoints + Services | ✓ | ●●○ | ●●○○ | $$ |
| AWS VPN / Direct Connect | ✓ | ●●● | ●●●● | $$$-$$$$ |
| Public internet + Authorization + TLS | ✓ | ●●● | ●○○○ | $$ |
B. Price breakdown #
The variety, complexity and difference of the outlined options require more in-depth research than outlined in the scope of this article. I agree with that. To make your life easier and to highlight the cryptic $ signs in the table above, I decided to create an example price breakdown and give you some specific numbers, based on which you can at least in some proximity figure whether an option is sutable for you or not.
To keep the numbers comparable, we will assume the following prerequisites:
- 5 AWS accounts (1 root and 4 product accounts)
- All accounts are located in single region (us-west-2), but in multiple AZs
- 500 GB of data transferred monthly
- Each account has an EKS cluster with 2 nodes (c7a.medium) in each
- 750 GB of storage for 1 month data retention and a little extra
Option 1: VPC Peering
- VPC Peering Connections: 4 × $0 = $0 / month
- Data Transfer (cross-AZ[2], bidirectional): 500 GB × 2 × $0,01/GB = $10/month
- NLBs in product accounts (Prometheus): 4 × $16.20/month = $64.80/month
- NLB in root account (Loki): $16.20/month
- NLB LCU charges: 500 GB × $0.006/GB = $3/month
- EC2 instances for EKS: 10 × $37.46/month = $374.6/month
- EBS storage (gp3): 750 GB × $0.08/GB = $60/month
Total Monthly Cost: $528.6
Option 2: AWS Transit Gateway
- Transit Gateway: $36/month
- TGW VPC Attachments: 5 × $0.05/hr = $180/month
- TGW Data Transfer: 500 GB × $0.02 = $10/month
- Data Transfer (cross-AZ, bidirectional): 500 GB × 2 × $0,01/GB = $10/month
- EC2 instances for EKS: 10 × $37.46/month = $374.60/month
- EBS storage (gp3): 750 GB × $0.08/GB = $60/month
Total Monthly Cost: $634.6
Option 3: AWS NLBs + VPC Endpoints + Services
- VPC Endpoints in root account (Prometheus): 4 × $0.01/hr = $28.4/month
- VPC Endpoints in product account (Loki): 4 × $0.01/hr = $28.4/month
- VPC Endpoint Data Transfer: 500 GB × $0.01/GB = $5/month
- NLBs in product accounts (Prometheus): 4 × $16.20/month = $64.80/month
- NLB in root account (Loki): $16.20/month
- NLB LCU charges: 500 GB × $0.006/GB = $3/month
- Data Transfer (cross-AZ, bidirectional): 500 GB × 2 × $0,01/GB = $10/month
- EC2 instances for EKS: 10 × $37.46/month = $374.60/month
- EBS storage (gp3): 750 GB × $0.08/GB = $60/month
Total Monthly Cost: $590.4
Option 4a: Site-to-Site VPN
- VPN Connections: 4 × $0.05/hour = $144/month
- VPN Data Transfer: 500 GB × $0.09/GB = $45/month
- Data Transfer (cross-AZ, bidirectional): 500 GB × 2 × $0,01/GB = $10/month
- EC2 instances for EKS: 10 × $37.46/month = $374.60/month
- EBS storage (gp3): 750 GB × $0.08/GB = $60/month
Total Monthly Cost: $633.6
Option 4b: AWS Direct Connect
- Direct Connect Port (1 Gbps): $0.30/hour = $216/month
- Direct Connect Data Transfer: 500 GB × $0.02 = $10/month
- Data Transfer (cross-AZ, bidirectional): 500 GB × 2 × $0,01/GB = $10/month
- EC2 instances for EKS: 10 × $37.46/month = $374.60/month
- EBS storage (gp3): 750 GB × $0.08/GB = $60/month
Total Monthly Cost: $670.6[3]
Option 5: Public Internet + TLS + Auth
- NLBs in product accounts (Prometheus): 4 × $16.20/month = $64.80/month
- NLB in root account (Loki): $16.20/month
- NLB LCU charges: 500 GB × $0.006/GB = $3/month
- Data Transfer (out to the internet): 500 GB × $0.09/GB = $45/month
- EC2 instances for EKS: 10 × $37.46/month = $374.60/month
- EBS storage (gp3): 750 GB × $0.08/GB = $60/month
Total Monthly Cost: $563.6
Pro tip
For pricing calculations, I used the following AWS resources::
- Amazon VPC pricing
- Elastic Load Balancing pricing
- Amazon EC2 On-Demand Pricing
- Amazon EBS pricing
- AWS Pricing Calculator
As well as this handy AWS EC2 instance and price comparison tool:
- Amazon EC2 Instance Type Comparison
C. IaC snippets #
The code presented in this section does not represent a fully working infrastructure. It highlights only the most relevant parts of the PoC implementation. It has not been tested and serves solely as a reference. You can copy it, but without additional initial setup (at minimum a VPC and an EKS cluster) and further adjustments, it will not work. Use at your own risk!
Product account
hcl# variables.tf
variable "eks_nlb_endpoint_services" {
  description = "EKS NLB endpoint services configuration"
  type = map(object({
    nlb_arn            = list(string)
    allowed_principals = list(string)
  }))
}

variable "loki_service_name" {
  description = "VPC Endpoint Service name for Loki"
  type = string
}

variable "tempo_service_name" {
  description = "VPC Endpoint Service name for Tempo"
  type = string
}

variable "vpc_id" {
  type        = string
}

variable "private_subnet_ids" {
  type        = list(string)
}

variable "name_prefix" {
  type        = string
}
hcl# main.tf
resource "aws_vpc_endpoint_service" "nlb_endpoint_services" {
  for_each = var.eks_nlb_endpoint_services

  acceptance_required        = true
  allowed_principals         = each.value.allowed_principals
  network_load_balancer_arns = each.value.nlb_arn
}

resource "aws_security_group" "observability" {
  name        = "${var.name_prefix}-observability"
  description = "Allow traffic from observability resources"
  vpc_id      = var.vpc_id
}

resource "aws_vpc_security_group_ingress_rule" "loki" {
  security_group_id = aws_security_group.observability.id
  description       = "Allow traffic from observability resources: Loki"
  cidr_ipv4         = "10.0.0.0/16"
  from_port         = 8080
  to_port           = 8080
  ip_protocol       = "tcp"
}

resource "aws_vpc_security_group_ingress_rule" "tempo" {
  security_group_id = aws_security_group.observability.id
  description       = "Allow traffic from observability resources: Tempo"
  cidr_ipv4         = "10.0.0.0/16"
  from_port         = 4317
  to_port           = 4318
  ip_protocol       = "tcp"
}

resource "aws_vpc_endpoint" "loki" {
  vpc_id              = var.vpc_id
  service_name        = var.loki_service_name
  vpc_endpoint_type   = "Interface"
  security_group_ids  = [aws_security_group.observability.id]
  subnet_ids          = var.private_subnet_ids
  private_dns_enabled = false
}

resource "aws_vpc_endpoint" "tempo" {
  vpc_id              = var.vpc_id
  service_name        = var.tempo_service_name
  vpc_endpoint_type   = "Interface"
  security_group_ids  = [aws_security_group.observability.id]
  subnet_ids          = var.private_subnet_ids
  private_dns_enabled = false
}
hcl# terraform.tfvars
eks_nlb_endpoint_services = {
  prometheus = {
    nlb_arn = [
      "arn:aws:elasticloadbalancing:us-west-2:${data.aws_caller_identity.current.account_id}:loadbalancer/net/xxxx-yyyy/zzzz"
    ]
    allowed_principals = ["arn:aws:iam::123456789012:root"]
  }
}
loki_service_name = "com.amazonaws.vpce.us-west-2.vpce-svc-qwertyuiop"
tempo_service_name = "com.amazonaws.vpce.us-west-2.vpce-svc-qwertyuiop"
vpc_id             = "vpc-xxxxx"
private_subnet_ids = ["subnet-xxxxx", "subnet-yyyyy"]
name_prefix        = "char"
Root account
hcl# variables.tf
variable "account_id" {
  type        = string
}

variable "name_prefix" {
  type        = string
}

variable "vpc_id" {
  type        = string
}

variable "private_subnet_ids" {
  type        = list(string)
}

variable "allowed_principals" {
  description = "Allowed AWS account principals for VPC endpoint services"
  type        = list(string)
}

variable "loki_nlb_arns" {
  type        = list(string)
}

variable "tempo_nlb_arns" {
  type        = list(string)
}

variable "char_normal_prometheus_vpcesvc_name" {
  description = "VPC Endpoint Service name for Prometheus; normal account"
  type        = string
}

variable "char_sparkling_prometheus_vpcesvc_name" {
  description = "VPC Endpoint Service name for Prometheus; sparkling account"
  type        = string
}
hcl# s3.tf
resource "aws_s3_bucket" "loki_chunks" {
  bucket = "${var.name_prefix}-${var.account_id}-loki-chunks"
}

resource "aws_s3_bucket" "loki_ruler" {
  bucket = "${var.name_prefix}-${var.account_id}-loki-ruler"
}

resource "aws_s3_bucket" "tempo" {
  bucket = "${var.name_prefix}-${var.account_id}-tempo-traces"
}
hcl# iam.tf
resource "aws_iam_policy" "loki_buckets" {
  name = "${var.name_prefix}-loki-buckets"

  policy = jsonencode({
    Version = "2012-10-17"
    Statement = [
      {
        Sid    = "LokiBuckets"
        Effect = "Allow"
        Action = [
          "s3:ListBucket",
          "s3:PutObject",
          "s3:GetObject",
          "s3:DeleteObject"
        ]
        Resource = [
          aws_s3_bucket.loki_chunks.arn,
          "${aws_s3_bucket.loki_chunks.arn}/*",
          aws_s3_bucket.loki_ruler.arn,
          "${aws_s3_bucket.loki_ruler.arn}/*"
        ]
      }
    ]
  })
}

resource "aws_iam_role" "loki_pod_identity" {
  name = "${var.name_prefix}-loki-pod-identity"

  assume_role_policy = jsonencode({
    Version = "2012-10-17"
    Statement = [
      {
        Sid    = "AllowEksAuthToAssumeRoleForPodIdentity"
        Effect = "Allow"
        Principal = {
          Service = "pods.eks.amazonaws.com"
        }
        Action = [
          "sts:AssumeRole",
          "sts:TagSession"
        ]
      }
    ]
  })

  tags = var.common_tags
}

resource "aws_iam_role_policy_attachment" "loki_pod_identity" {
  role       = aws_iam_role.loki_pod_identity.name
  policy_arn = aws_iam_policy.loki_buckets.arn
}

resource "aws_iam_policy" "tempo_bucket" {
  name = "${var.name_prefix}-tempo-bucket"

  policy = jsonencode({
    Version = "2012-10-17"
    Statement = [
      {
        Sid    = "LokiBuckets"
        Effect = "Allow"
        Action = [
          "s3:ListBucket",
          "s3:PutObject",
          "s3:GetObject",
          "s3:DeleteObject",
          "s3:GetObjectTagging",
          "s3:PutObjectTagging"
        ]
        Resource = [
          aws_s3_bucket.tempo.arn,
          "${aws_s3_bucket.tempo.arn}/*"
        ]
      }
    ]
  })
}

resource "aws_iam_role" "tempo_pod_identity" {
  name = "${var.name_prefix}-tempo-pod-identity"

  assume_role_policy = jsonencode({
    Version = "2012-10-17"
    Statement = [
      {
        Sid    = "AllowEksAuthToAssumeRoleForPodIdentity"
        Effect = "Allow"
        Principal = {
          Service = "pods.eks.amazonaws.com"
        }
        Action = [
          "sts:AssumeRole",
          "sts:TagSession"
        ]
      }
    ]
  })
}

resource "aws_iam_role_policy_attachment" "tempo_pod_identity" {
  role       = aws_iam_role.tempo_pod_identity.name
  policy_arn = aws_iam_policy.tempo_bucket.arn
}

resource "aws_eks_pod_identity_association" "loki" {
  cluster_name    = var.name_prefix
  namespace       = "monitoring"
  service_account = "loki"
  role_arn        = aws_iam_role.loki_pod_identity.arn
}

resource "aws_eks_pod_identity_association" "tempo" {
  cluster_name    = var.name_prefix
  namespace       = "monitoring"
  service_account = "tempo"
  role_arn        = aws_iam_role.tempo_pod_identity.arn
}
hcl# vpc.tf
resource "aws_vpc_endpoint_service" "loki" {
  acceptance_required        = true
  allowed_principals         = var.allowed_principals
  network_load_balancer_arns = var.loki_nlb_arns
}

resource "aws_vpc_endpoint_service" "tempo" {
  acceptance_required        = true
  allowed_principals         = var.allowed_principals
  network_load_balancer_arns = var.tempo_nlb_arns

}

resource "aws_vpc_endpoint" "char-normal-prometheus" {
  vpc_id              = var.vpc_id
  service_name        = var.char_normal_vpcesvc_name
  vpc_endpoint_type   = "Interface"
  security_group_ids  = [aws_security_group.observability.id]
  subnet_ids          = var.private_subnet_ids
  private_dns_enabled = false
}

resource "aws_vpc_endpoint" "char-sparkling-prometheus" {
  vpc_id              = var.vpc_id
  service_name        = var.char_sparkling_vpcesvc_name
  vpc_endpoint_type   = "Interface"
  security_group_ids  = [aws_security_group.observability.id]
  subnet_ids          = var.private_subnet_ids
  private_dns_enabled = false
}

resource "aws_security_group" "observability" {
  name        = "observability"
  description = "Allow traffic from observability resources"
  vpc_id      = var.vpc_id
}

resource "aws_vpc_security_group_ingress_rule" "prometheus" {
  security_group_id = aws_security_group.observability.id
  cidr_ipv4         = "10.0.0.0/16"
  from_port         = 9090
  to_port           = 9090
  ip_protocol       = "tcp"
}
hcl# terraform.tfvars.example
account_id                             = "123456789012"
name_prefix                            = "ketch"
vpc_id                                 = "vpc-xxxxx"
private_subnet_ids                     = ["subnet-xxxxx", "subnet-yyyyy"]
loki_nlb_arns                          = ["arn:aws:elasticloadbalancing:us-west-2:${var.account_id}:loadbalancer/net/xxxx-yyyy/zzzz"]
tempo_nlb_arns                         = ["arn:aws:elasticloadbalancing:us-west-2:${var.account_id}:loadbalancer/net/xxxx-yyyy/zzzz"]
char_normal_prometheus_vpcesvc_name    = "com.amazonaws.vpce.us-west-2.vpce-svc-xyz"
char_sparkling_prometheus_vpcesvc_name = "com.amazonaws.vpce.us-west-2.vpce-svc-xyz"
allowed_principals = [
  "arn:aws:iam::111111111111:root",
  "arn:aws:iam::222222222222:root"
]
It doesn't matter all that much which approach you choose to implement for monitoring your monitoring. In light of recent events, some folks even created a downdetector for a downdetector's downdetector. I mean, it's hilariously fun, but the key point remains solid: you need to know whether your eyes and ears (infrastructure-wise) are even working. ↩︎
We assume 100% cross-AZ traffic in this example to maximize potential traffic costs and avoid complicating the calculations with percentages of same-AZ versus cross-AZ traffic. ↩︎
Direct Connect may also require a specific partner to enable and perform the physical connection to the AWS network, so expect to add a few hundred (or even thousands) of dollars on top of the initial bill for setup. ↩︎